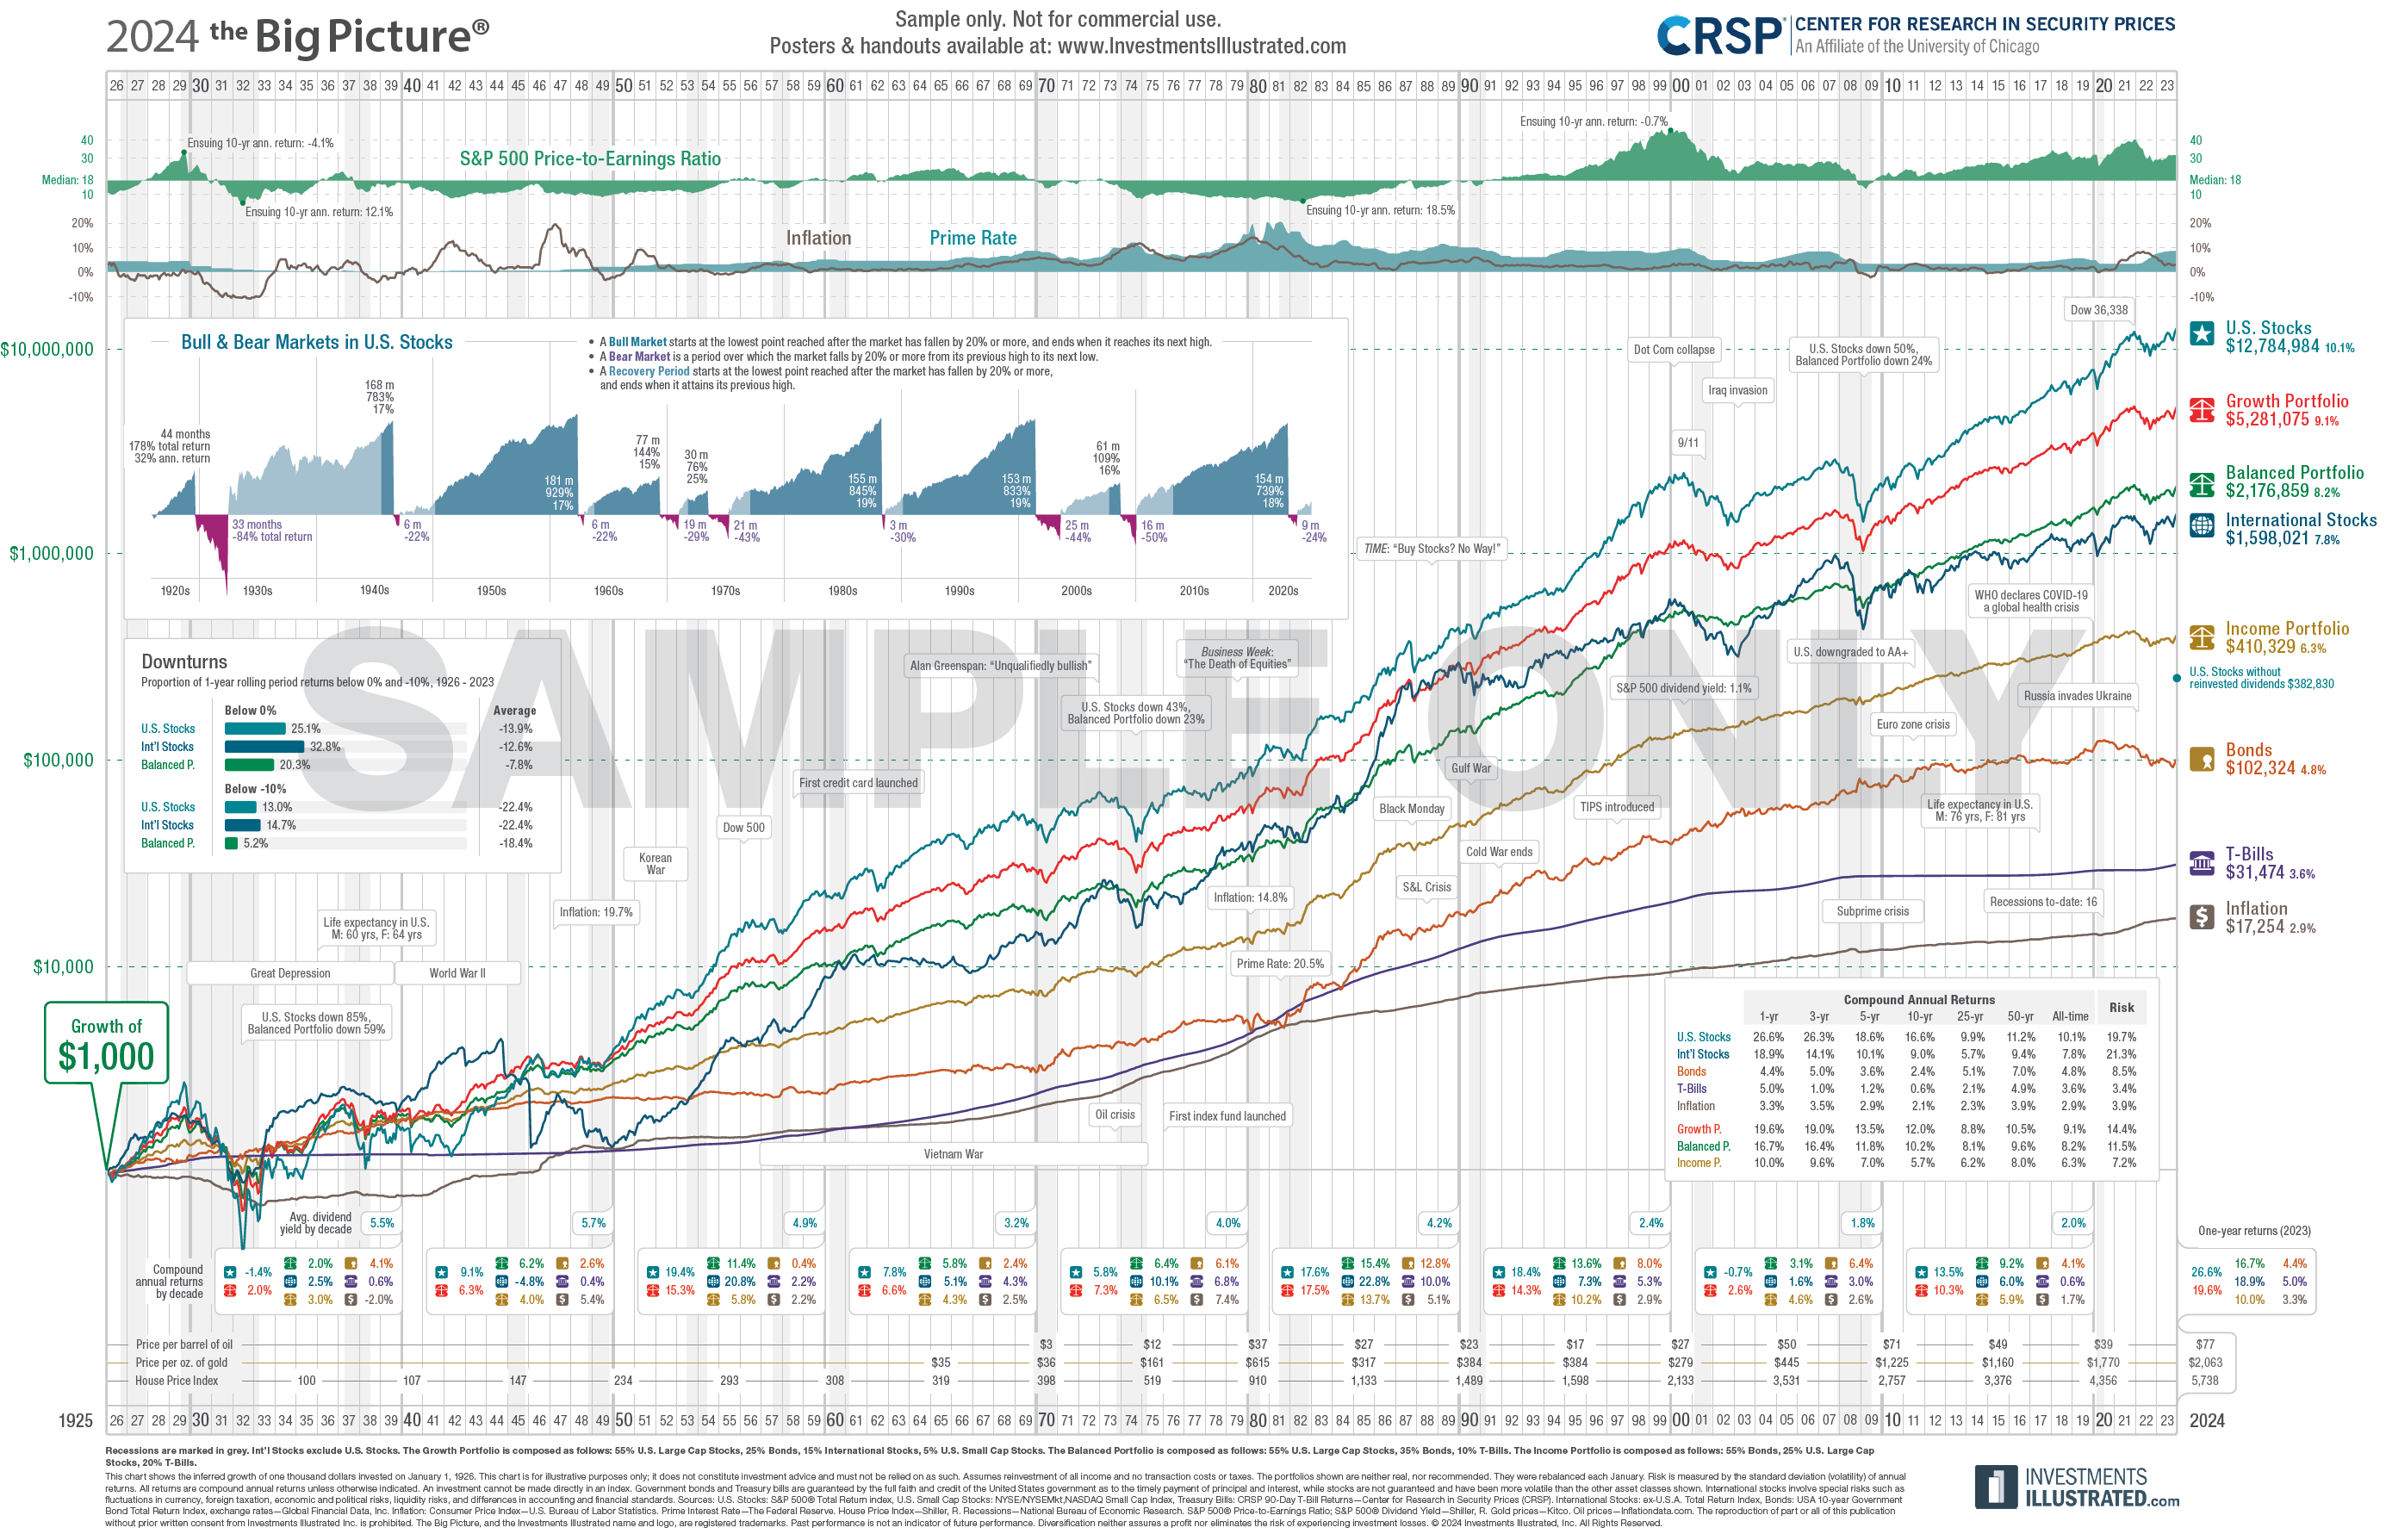
CRSP partners with Investments Illustrated, the leading financial illustration firm, to present a series of charts on long-run risk and return performance.
The 1926 starting point for historical data is a result of the initial study by Chicago Booth Professors Jim Lorie and Larry Fisher found in their seminal research paper Rates of Return on Investments in Common Stock.
To learn more about their digital and print-based financial illustration services, please contact Investments Illustrated.